Technical annex Download
7 Response rates
7.1 Unadjusted response rates (published)
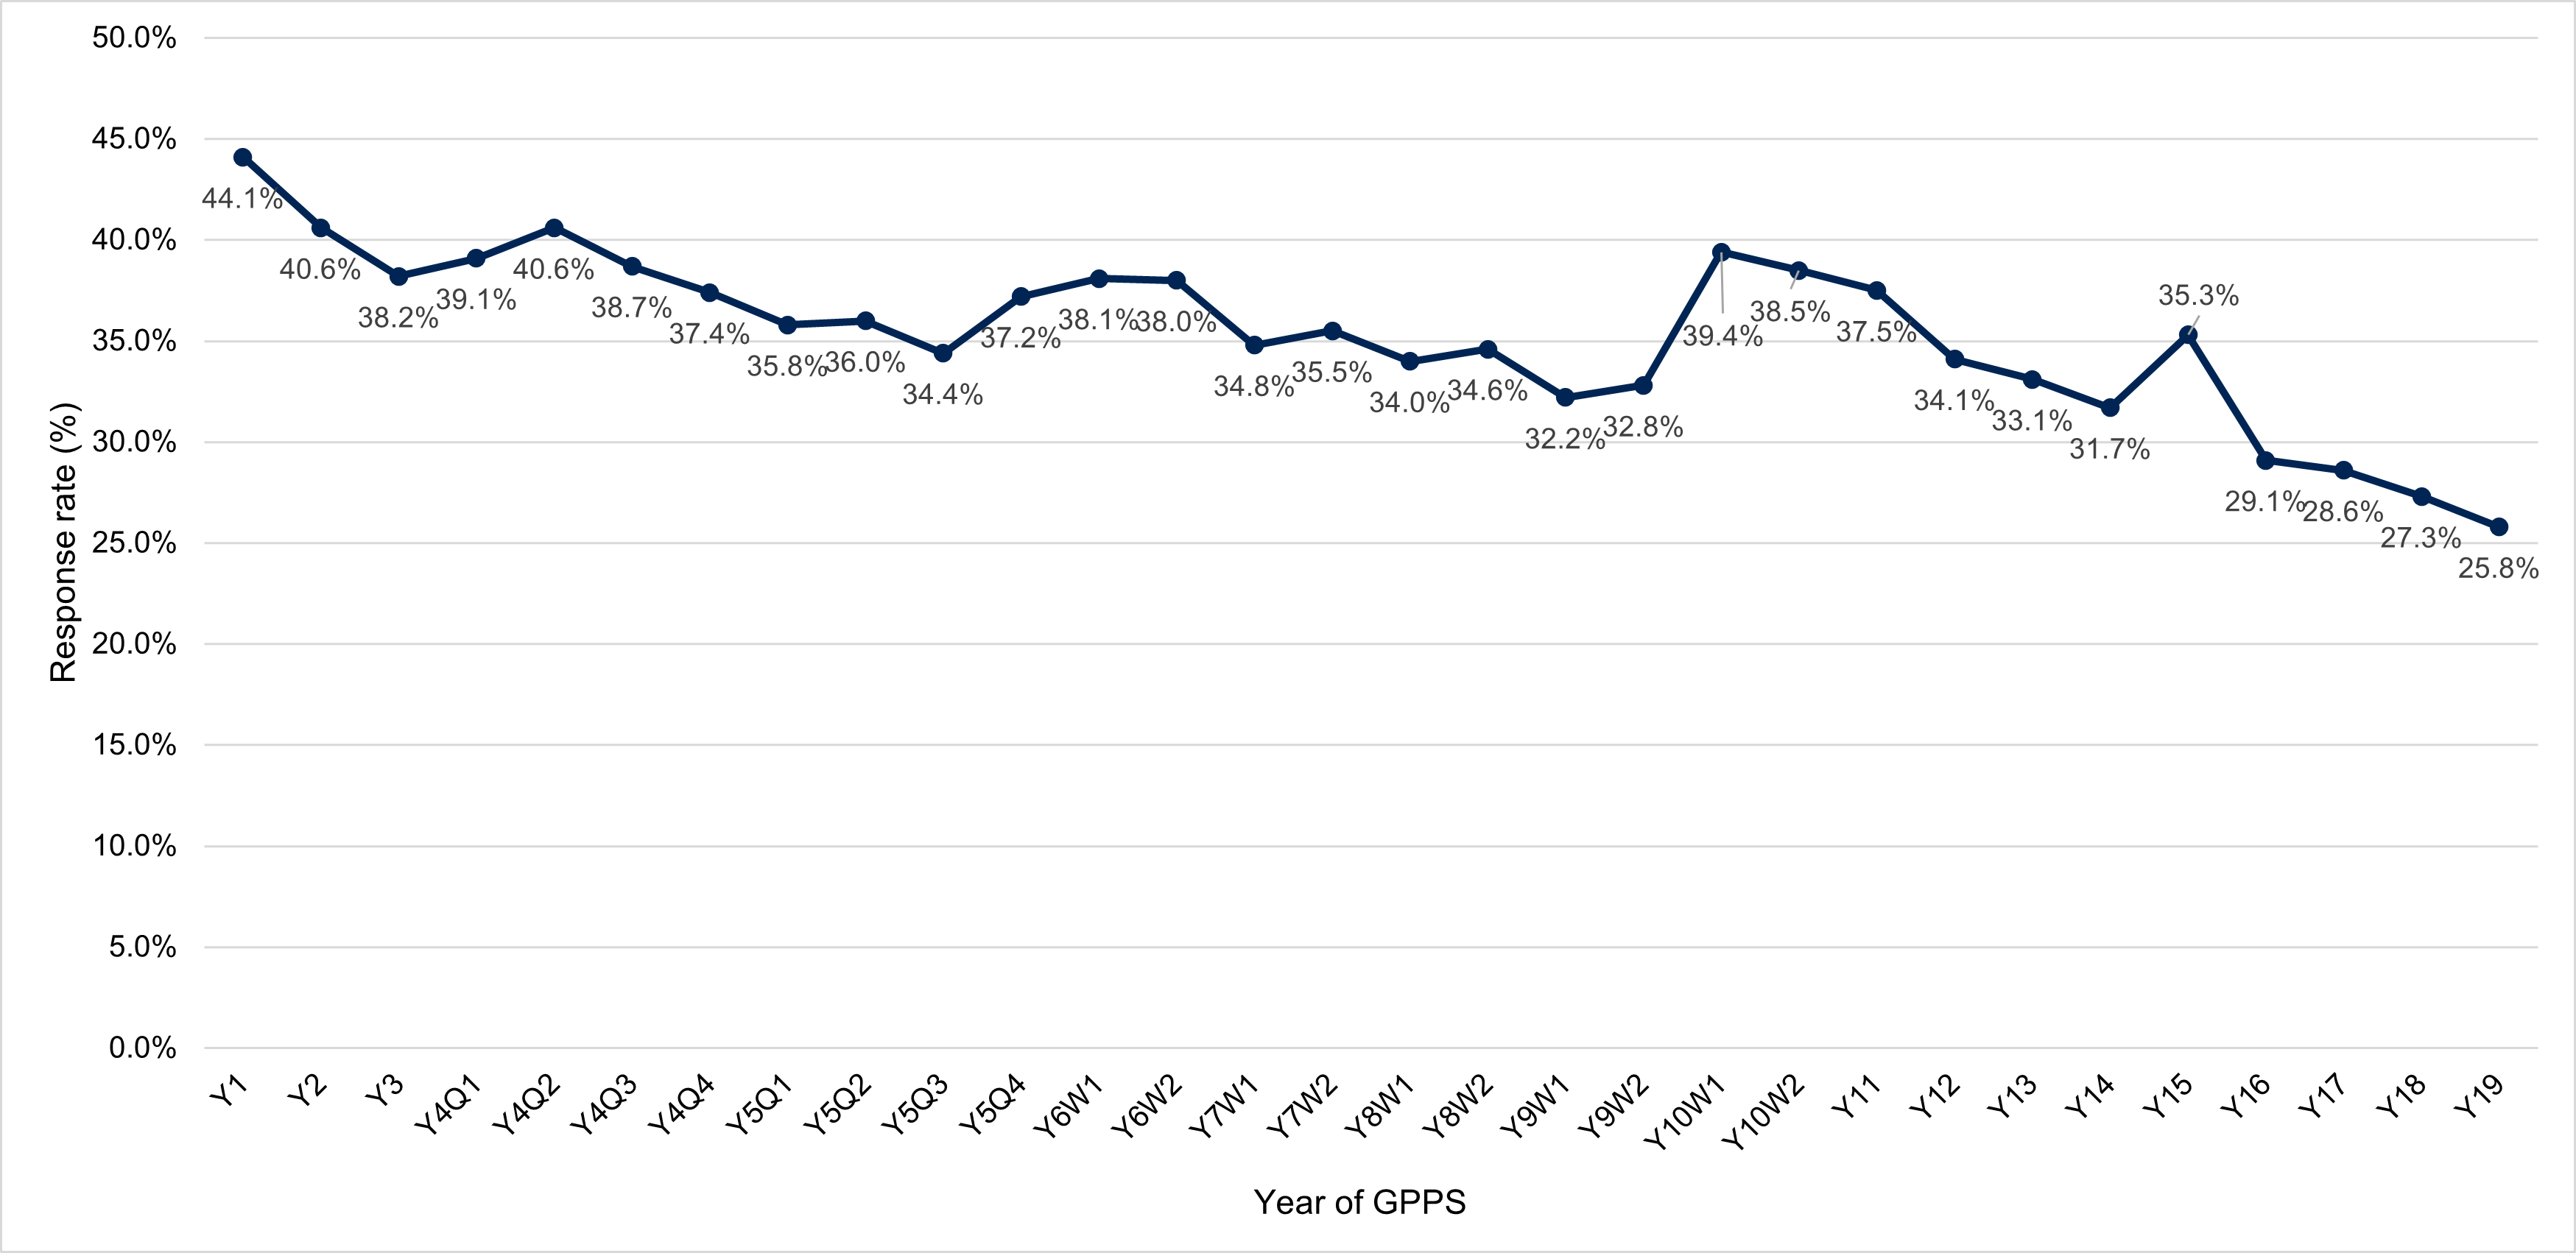
The overall response rate for England was 25.8%, based on 2,721,415 questionnaires sent out and 702,837 returned.
Table 7.1: Surveys sent, returned and response rates
| Number sent | Number returned | Response rate | |
|---|---|---|---|
| Total | 2,721,415 | 702,837 | 25.8% |
Table 7.2: Response rates for female and male
| 2024 | |
|---|---|
| Female | 29.9% |
| Male | 21.9% |
Table 7.3: Response rates by age
| 2024 | |
|---|---|
| 16-17 | 14.4% |
| 18-24 | 8.5% |
| 25-34 | 10.6% |
| 35-44 | 16.1% |
| 45-54 | 25.8% |
| 55-64 | 39.6% |
| 65-74 | 53.1% |
| 75-84 | 52.1% |
| 85+ | 35.5% |
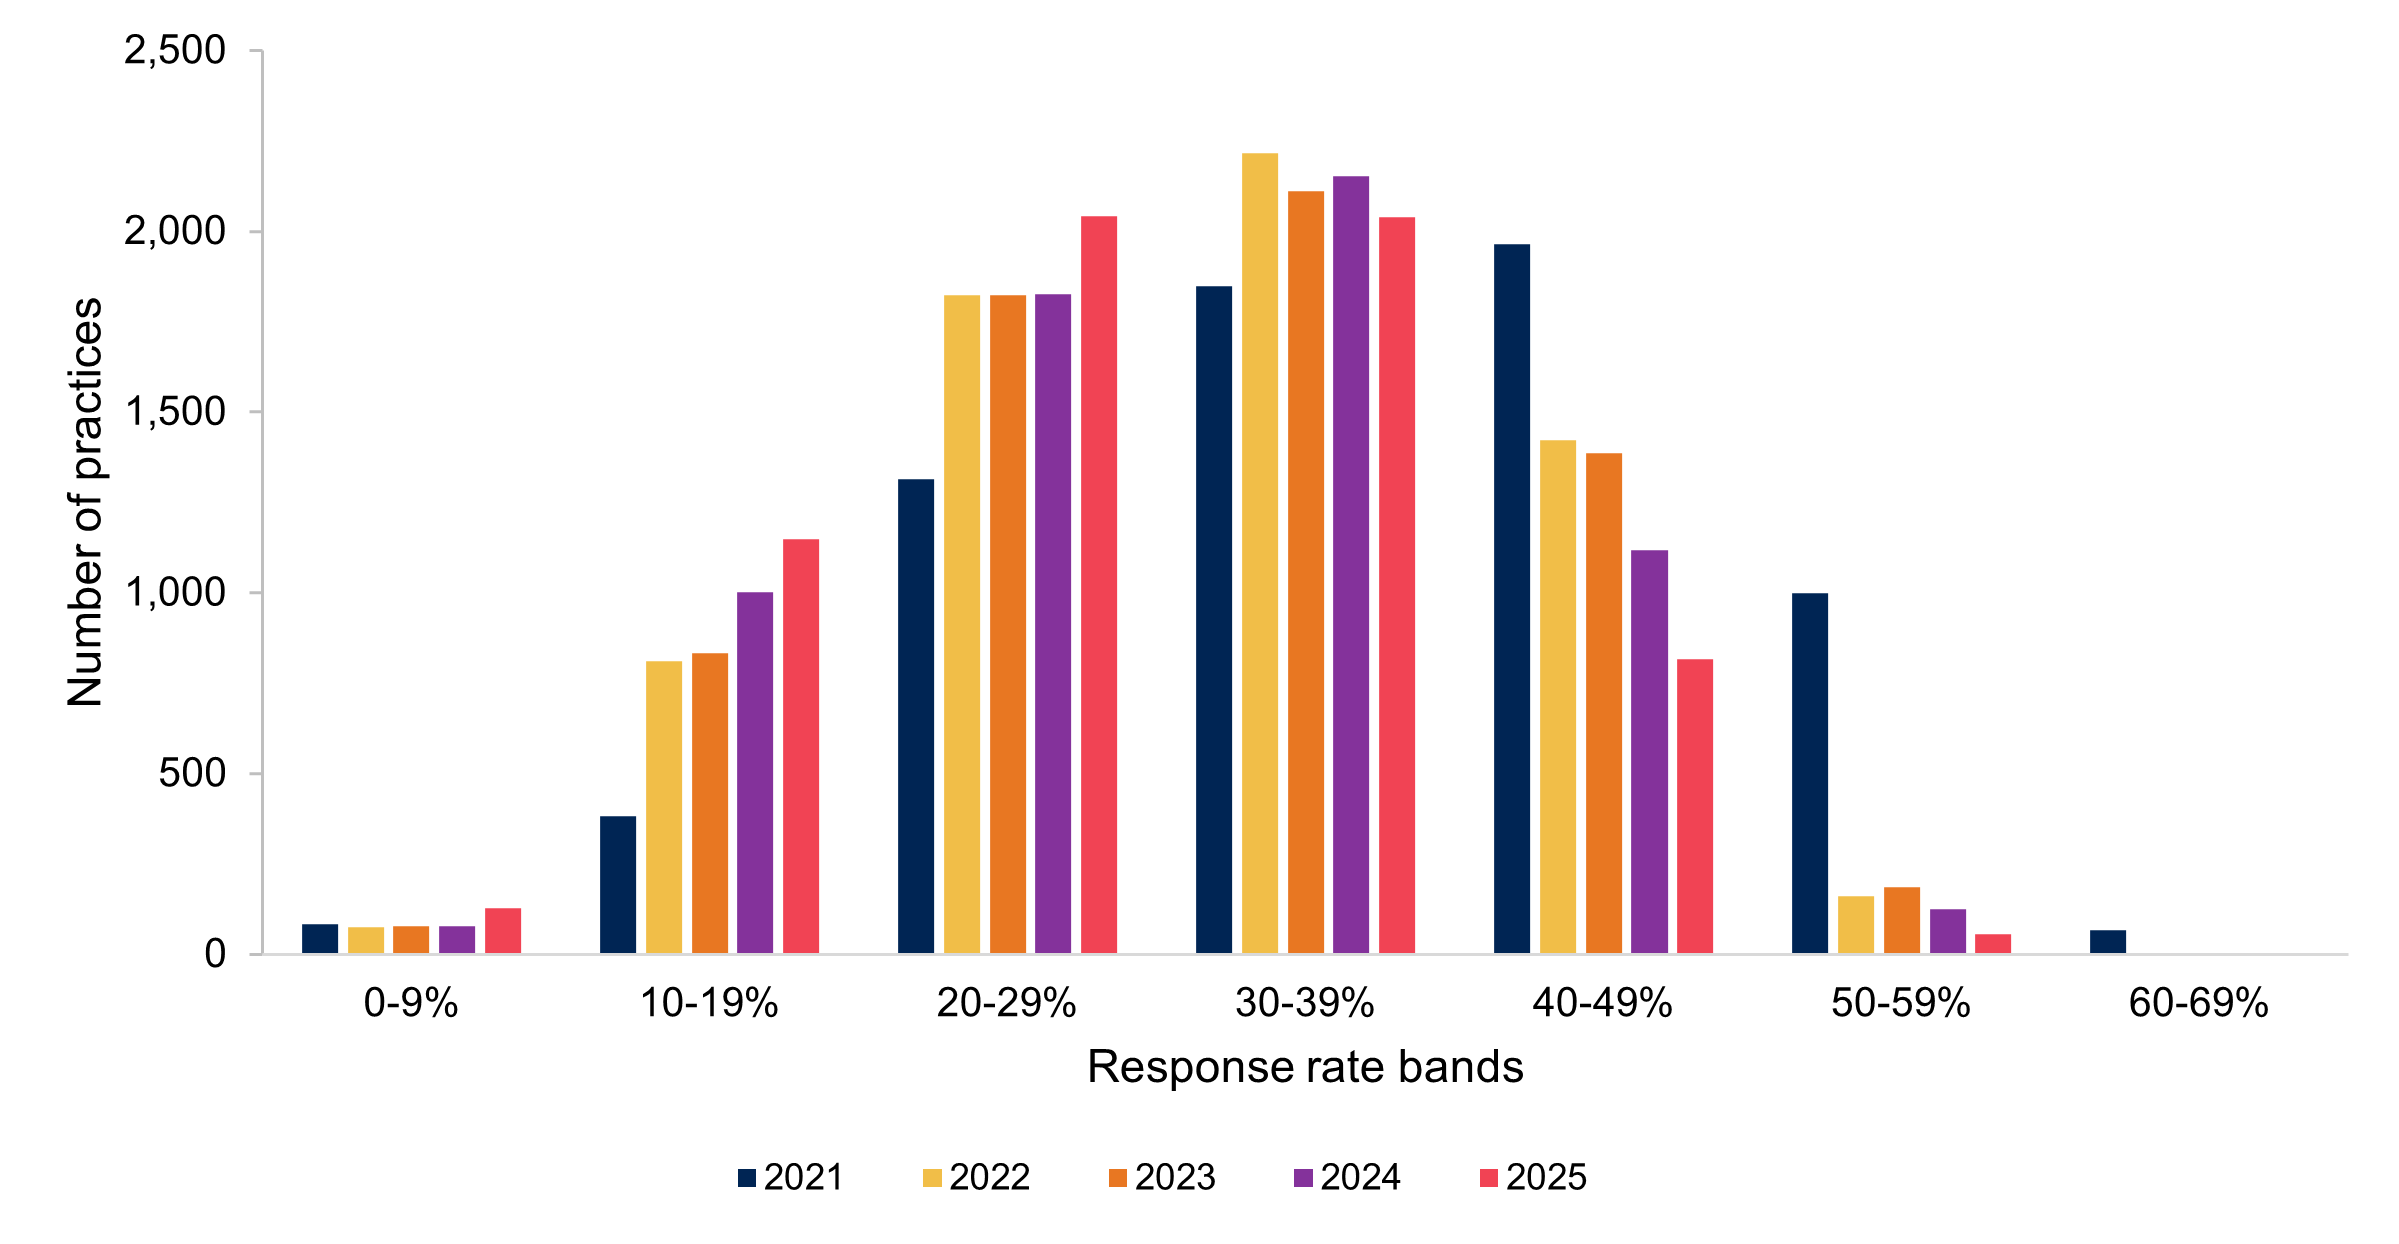
Figure 7.1: Number of practices within each response rate band over time

Table 7.4: Number and proportion of practices within each response rate band4
| Practices in 2025 | Practices in 2024 | Practices in 2023 | Practices in 2022 | Practices in 2021 | ||||||
|---|---|---|---|---|---|---|---|---|---|---|
| No. | % | No. | % | No. | % | No. | % | No. | % | |
| 0-9% | 128 | 2% | 79 | 1% | 77 | 1% | 74 | 1% | 84 | 1% |
| 10-19% | 1,148 | 18% | 1,003 | 16% | 834 | 13% | 810 | 12% | 382 | 6% |
| 20-29% | 2,043 | 33% | 1,827 | 29% | 1,822 | 28% | 1,823 | 28% | 1,313 | 20% |
| 30-39% | 2,039 | 33% | 2,152 | 34% | 2,111 | 33% | 2,215 | 34% | 1,847 | 28% |
| 40-49% | 815 | 13% | 1,119 | 18% | 1,385 | 22% | 1,423 | 22% | 1,965 | 30% |
| 50-59% | 56 | 1% | 125 | 2% | 185 | 3% | 160 | 2% | 999 | 15% |
| 60-69% | 1 | * | 2 | * | 4 | * | 2 | * | 68 | 1% |
| Total | 6,230 | 100% | 6,307 | 100% | 6,418 | 100% | 6,507 | 100% | 6,658 | 100% |
4Please note that an asterisk (*) indicates a percentage of less than 0.5% but greater than 0.
For response rates prior to 2021, please see the 2020 technical annex.
Figure 7.2: National response rates to the survey over time

7.2 Adjustments to response rate
Alternative presentations of response rates can mitigate the effects that some elements of a survey’s methodology might have on the response rate calculation. Two such presentations are explained below.
7.2.1 Weighted response rate
As described in Chapter 3: Sampling, the issued samples in GP practices with lower response rates are boosted to achieve a minimum sample size. One implication of this is that the issued sample is skewed towards GP practices where participation is likely to be lower. In other words, a patient registered at a practice with a low response rate has a higher chance of being selected for the GPPS than one at a same-sized practice with a high response rate. As a result, one would expect to observe a lower response rate overall compared with a design in which the sample was allocated to GP practices in proportion. Further, it means that comparisons of response rates between waves and with other surveys could be misleading as, by design, the GPPS over-samples patients who are less likely to participate, to ensure sufficient results are achieved from as many practices as possible.
To demonstrate the impact of this, it is recommended that both unweighted and weighted estimates of response rates are presented for samples with unequal selection weights. For example, Lynn et al. write that:
'The importance of weighted outcome rates stems from the possibility that response rates could differ across strata or other intermediate sampling units which have different inclusion probabilities'5
Lynn et al.
For the GPPS sample, we know by design that the GP practices (the strata) in which patients have a higher inclusion probability are those with a lower response rate. A weighted response rate can therefore be calculated with the issued sample weighted by the original selection weight.
7.2.2 Adjusted response rate
It is also standard practice on many surveys to adjust the response rate to take into account the ineligible sample, i.e. participants who could never have been contacted or received a survey during the fieldwork period. For a push-to-web survey it is difficult to calculate the postal element, but taking a conservative approach, it is possible to exclude undeliverable post, so those who did not receive a questionnaire pack. This is referred to as an adjusted response rate.
Table 7.5 presents both the weighted and adjusted response rates alongside the published (unweighted and unadjusted) response rate.
Table 7.5: Unweighted, weighted and adjusted response rates
| Unweighted/unadjusted response rate (published) | Weighted response rate (unadjusted) | Adjusted response rate (unweighted) | |
|---|---|---|---|
| 2025 | 25.8% | 29.4% | 26.8% |
5Source: Peter Lynn, Roeland Beerten, Johanna Laiho and Jean Martin (2001) Recommended Standard Final Outcome Categories and Standard Definitions of Response Rate for Social Surveys. ISER Working Papers Number 2001-23.


