Technical annex Download
- 1 Introduction
- 2 Questionnaire and material design
- 3 Sampling
- 4 Communications with patients and practices
- 5 Data collection
- 6 Data analysis
- 7 Response rates
- 8 Reporting
- 8.1 Official statistics status of GPPS results
- 8.2 Presentation of results
- 8.3 Calculation of results and percentages
- 8.4 Trend data
- 8.5 Suppression
- 8.6 Weighting
- 8.7 Organisaton mapping
- 8.8 Changes to Excel reports
- 8.9 Deliverables
- 8.10 The GPPS 'Surveys and Reports' page
- 8.11 The GPPS analysis tool
- 8.12 Practice comparison tool
- 9 Data quality statement
- 10 Appendix
8 Reporting
8.1 Official statistics status of GPPS results
GPPS results are official statistics. Official statistics are statistics produced on behalf of the UK government. Producers of official statistics follow the professional standards in the Code of Practice for Statistics, to provide official statistics that serve the public good. For more information on the Code of Practice for Statistics, please see the UK Statistics Authority website at: https://code.statisticsauthority.gov.uk//
However, this year, in addition to the core (online and paper) questionnaire, a small number of additional questions were included in the online version of the survey only. It was not possible to include these in the paper questionnaire due to space constraints. A list of these online-only questions is available in section 2.2
The inclusion of online-only questions is a new development for GPPS and, as such, results for these questions are labelled as ‘official statistics in development’, in line with the standards in the Code of Practice for Statistics. The trustworthiness, quality and value of these statistics will be evaluated with a view to removing the ‘in development’ label in time. As a result, user feedback on the need for these statistics and how they are being used is important. Please share any feedback on the online-only questions with: GPPatientSurvey@ipsos.com.
8.2 Presentation of results
Many of the GP Patient Survey (GPPS) outputs lead with a summary result; a single statistic that provides a quick way of viewing the result for a question. This is usually an aggregation of two individual responses (e.g. ‘% Easy’ is a combination of ‘% Very easy and ‘% Fairly easy’) or a single response option (e.g. ‘% Yes’).
For some questions it is not appropriate to present a summary result; for instance, where it is more useful to look at the responses individually and there is not a particular answer that suggests a more (or less) positive experience. An example of this is Q5 ‘Which of the following online GP services have you used in the last 12 months?’.
8.3 Calculation of results and percentages
Typically, all response options are included in the calculation of a question result. However, for some questions certain response options are excluded from the result where appropriate (e.g. 'I haven’t tried', 'I can’t remember', 'I don’t know'), to provide a more accurate reflection of how those using a service evaluate it. These responses in general do not provide information about a patient’s experience of primary care services. If a response is excluded from a result, these are noted in the Presentation of results.
Using Question 1 as an example, removing those who said ‘I haven’t tried’ to get through to their GP practice on the phone from the calculation provides a better reflection of the views of patients who had tried. This is shown in the table below using dummy data. Numbers and percentages are presented for the five response options ‘Very easy’, ‘Fairly easy’, ‘Neither easy or difficult’, ‘Fairly difficult’, and ‘Very difficult’.
| Q1 Generally, how easy or difficult is it to contact your GP practice on the phone? | |||||
|---|---|---|---|---|---|
| Results | Summary results | ||||
| n | % | n | % | ||
| I haven’t tried | / | / | / | / | / |
| Very easy | 20 | 20% | Easy | 45 | 45% |
| Fairly easy | 25 | 25% | |||
| Neither easy nor difficult | 25 | 25% | / | 25 | / |
| Fairly difficult | 15 | 15% | Difficult | 30 | 30% |
| Very difficult | 15 | 15% | |||
| Base | 100 | 100% | 100 | 100% | |
In addition, there are six questions where the excluded response option percentages are presented separately in some reports, as these are likely to be of particular interest:
-
Question 1: ‘I haven’t tried’ – Generally how easy or difficult is it to contact your GP practice on the phone?
-
Question 2: ‘I haven’t tried’ – Generally how easy or difficult is it to contact your GP practice using their website?
-
Question 3: ‘I haven’t tried’ – Generally how easy or difficult is it to contact your GP practice using the NHS App?
-
Question 7: 'I haven’t tried’ – How often do you get to see or speak to your preferred healthcare professional when you ask to?
-
Question 19: 'I didn't need a choice' – Were you offered the following choices?
-
Question 43: 'I haven't needed support' – In the last 12 months, have you had enough support from local services or organisations to help you manage your conditions or illnesses?
Some questions in the survey are multiple choice, allowing patients to provide more than one response to a question. An example of this is Q5 (Which of the following online GP services have you used in the last 12 months?). For these questions, percentages are calculated using the total number of people who responded to the question as the denominator.
If you have any questions about the presentation of the results, please email the Ipsos research team.
8.4 Trend data
Every year the questionnaire content is reviewed to reflect the changing primary care context and priorities. This led to minor changes to the wording of some of the response options for two questions which has impacted trends. These changes have affected the comparability of these questions, even though question wording remains the same. This is because it is difficult to determine whether a difference in results is caused by the change to the response options or a 'real difference'.
-
Trends are not presented for Q9: 'On that occasion, what was your main reason for trying to contact your GP practice?'
-
Trends are not presented for the long-term condition ‘Arthritis or problem with your back or joints' at Q39 ('Which of the following long-term conditions or illnesses do you have?) and the 2024 response option ('Joint problem, such as arthritis') as these are not directly comparable.
More information on the changes to the questionnaire is available in Chapter 2: Questionnaire and material design. For an overview of the changes to the 2025 survey, please see the Changes to the 2025 survey.
Additional historical data is available for GPPS on the survey website. Prior to 2024 (and the start of a new time series) there have been a number of key breaks in trends to note. This includes a previous significant change to the questionnaire and extension of the sampling frame to include 16- and 17-year-olds in 2018. Please see the 2018 Technical Annex for further detail.
In addition, analysis in Year 11 (2017) identified a fieldwork timing effect, the impact of the survey moving from a bi-annual format (between 2011 and 2016) to annual in 2017. This found evidence of systematic differences in the data collected between the Wave 1 (July-September) and Wave 2 (January-March) fieldwork periods. For full details of this analysis please see the Technical note on fieldwork timing effect.
Finally, please note if manually comparing data from 2019 onwards with 2018 using the Excel/csv reports published in their respective years, the percentages for some questions are calculated differently (as outlined in the ‘Calculation of results’ section above), and care should be taken to ensure that any results are compared on the same basis. Please see the Presentation of results document for further information.
8.5 Suppression
Suppression is used to prevent individuals and their responses being identifiable in the data, and to ensure results based on very small numbers of respondents are not released.
The GP Patient Survey uses two types of suppression:
-
In cases where a result is based on fewer than 10 people (unweighted), it has been suppressed. For example, where fewer than 10 people answered a question from a particular organisation, the results are not shown. This method was amended in 2023 to use just the unweighted base.
-
In addition, for organisations with an eligible population of 1,000 or less, individual response option counts below 5 (but excluding 0) and corresponding percentages have been suppressed for the relevant questions in the 'Some questions about you' section and questions identifying participants as having, or not having, long-term conditions, disabilities, or illnesses. In instances where only one response option is suppressed for these questions, the next lowest response option has also been suppressed to prevent back calculation of the primary suppressed result. The questions which this suppression method relates to are listed in the table 8.1 below. ‘Population’ for the GP Patient Survey is defined as the number of patients on the GP registered list for that organisation.
‘Population’ for the GP Patient Survey is defined as the number of patients on the GP registered list for that organisation.
Please note due to the technical limitations of the analysis tool and the PCN dashboard it has not been possible to apply this suppression method to the affected organisations and questions. As such, these specific question results for these organisations are not available in these outputs. The number of organisations affected for the relevant questions is very small. To see the full results for an organisation, if not available in the tool or dashboard, please visit the Survey and Reports page: www.gp-patient.co.uk/surveysandreports
An additional suppression measure has been taken for Q38 (‘Do you have any physical or mental health conditions or illnesses lasting, or expected to last, 12 months or more?’) due to the question including a response that is excluded from percentage calculations. Where fewer than 5 or more than 0 patients selected ‘I don’t know’, the total base has been suppressed to prevent back-calculation of a suppressed response.
Table 8.1: List of quasi-identifiable questions
| Question text | |
|---|---|
| Long term condition status (Q38) | Do you have any physical or mental health conditions or illnesses lasting, or expected to last, 12 months or more? |
| Long term condition (Q39) | Which of the following long-term conditions or illnesses do you have? |
| Long COVID (Q40) | Would you describe yourself as having ‘long COVID’? That is, you are still experiencing symptoms more than 12 weeks after you first had COVID-19 that are not explained by something else? |
| Age (Q54) | How old are you? |
| Which of the following best describes you? (Q55) | Which of the following best describes you? |
| Is your gender identity the same as the sex you were registered at birth? (Q56) | Is your gender identity the same as the sex you were registered at birth? |
| Sexual orientation (Q57) | Which of the following best describes how you think of yourself? |
| Ethnicity (Q58) | What is your ethnic group? |
| Religion (Q59) | Which, if any, of the following best describes your religion? |
| Occupation status (Q60) | Which of the following best describe what you are doing at present? |
| Carer status (Q61) | Do you look after, or give any help or support to, anyone because they have long-term physical or mental health conditions or illnesses, or problems related to old age? |
| Parent or legal guardian status (Q62) | Are you a parent or a legal guardian of any children aged under 16 living in your home? |
8.6 Weighting
All published GPPS outputs show the weighted results. Weighting ensures results are more representative of the population of patients aged 16 or over registered with a GP practice. Unweighted base sizes, alongside weighted base sizes, are reported in most outputs to provide transparency on the actual number of patients who responded to a question.
Further information of the weighting strategy is provided in section 6.5.
8.7 Organisation mapping
GP practices are mapped to Integrated Care Systems and NHS Regions using the ‘epraccur’ file and are mapped to Primary Care Networks using the ‘ePCN’ file, both available from NHS England Digital. The ‘epraccur’ and ‘ePCN’ files used are the versions available at the end of fieldwork (March/April) , therefore results are presented under the latest organisation names available upon fieldwork closing.
Practices are mapped to organisations (sub-ICB, ICB and region) based on the commissioner for the GP practice. Please note this mapping in some cases may not reflect where patients live.
For example, the survey includes participants who are registered with a GP practice in England but live in Wales.
8.8 Changes to reporting outputs
Each year the reporting outputs are reviewed based on feedback from users and against the NHS Information Standards and other government guidance for publishing statistical publications. The changes for 2025 are minor, and include the publication of a regional csv data file to support users with regional level analysis. All changes are outlined in the Changes to the 2025 survey.
8.9 Deliverables
The survey reporting specifications were created by Ipsos in collaboration with NHS England. The specifications detail the content and layout of each of the outputs (Excel, PowerPoint reports, Power BI and SPSS datasets).
All data and reports are encrypted and supplied to NHS England via a secure FTP (File Transfer Protocol) site. Ipsos work closely with NHS England to quality assure the data and reports. In 2025 a different approach has been adopted. Whereas in previous years NHS England independently verified each report and dataset, this is now done for the national data and reports only. For all other outputs Ipsos share comprehensive quality assurance evidence with NHS England.
Tables 8.2 to 8.4 describe the reports and datasets which are produced, including the presentation of statistics in each.
Table 8.2: Reports (published via the www.gp-patient.com website)
| Detail / purpose | |
|---|---|
| National report | National results presented in a PowerPoint report |
| National results | National results for all questions, presented in table format (Excel) |
| National infographic | Selected national headline results in a visual format |
| ICS slide packs | 42 PowerPoint reports containing results for a selection of key questions for individual ICSs (and variation by PCN within ICS) |
| PCN dashboard (PowerBI) (gp-patient.co.uk/pcn-dashboard) | An interactive, visual tool showing results for each PCN (Primary Care Network) in PowerBI, hosted on the GPPS website, showing variation by practice within PCN and comparisons with national results |
| Patient experience and compare practices tool (gp-patient.co.uk) | Results for a selection of key questions for individual practices (alongside ICS and national results). Compare a practice with up to two other practices. Filter results by demographics (age, ethnicity, long-term condition, or disability status |
| GP practice output | Downloadable results for every GP practice in a visual PowerPoint format for a selection of questions |
| Analysis tool (gp-patient.co.uk/analysistool) | Use the analysis tool to look at the survey results (at national, ICS, PCN and practice level), and to analyse results for specific groups of patients (e.g. by age, ethnicity and more) |
| National data (.csv) | A CSV (Comma-separated value) file that contains the national-level results. |
| Regional data (.csv) | A CSV (Comma-separated value) file that contains the regional-level results.. |
| ICS results (Excel) | An Excel report containing the ICS-level results and the national results presented in a table format |
| ICS data (.csv) | A CSV (Comma-separated value) file that contains the ICS-level results. |
| PCN results (Excel) | An Excel report containing the PCN-level results and the national results presented in a table format |
| PCN data (.csv) | A CSV (Comma-separated value) file that contains all the PCN-level results. |
| Practice results (Excel) | An Excel report containing the practice-level results and the national results presented in a table format |
| Practice data (.csv) | A CSV (Comma-separated value) file that contains all the practice-level results |
Table 8.3: Weighted and unweighted datasets provided to NHS England (not published)
| Detail / Purpose | |
|---|---|
| Person dataset | Person level dataset (SPSS) to allow for a range of further analysis |
| Practice dataset | Practice level dataset (SPSS) to allow for a range of further analysis |
| PCN dataset | PCN level dataset (SPSS) to allow for a range of further analysis |
| ICS dataset | ICS level dataset (SPSS) to allow for a range of further analysis |
| National dataset | National level dataset (SPSS) to support further analysis |
| Dentistry person dataset | Person level dataset (SPSS) to allow for a range of further analysis based on dentistry questions |
Table 8.4: Technical documents (published via the website)
| Detail / Purpose | |
|---|---|
| Technical annex | Report to communicate operational details of the survey |
| Presentation of results | Excel report to explain how results are calculated and presented across the various survey outputs |
| List of reporting variables | A CSV (Comma-separated value) file that lists all the survey questions and where you can find them in the CSV files |
| Changes to the survey | A report to explain the year-to-year changes made to the survey |
8.10 The GPPS 'Surveys and Reports' page
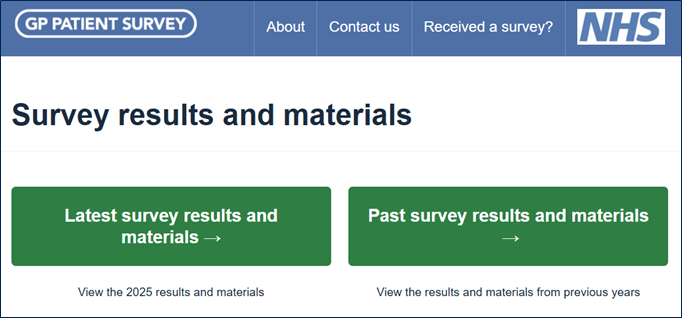
The Survey and Reports page on the GPPS website allows users to access and download the published surveys and reports including ICS slide packs, the PCN dashboard, Excel/csv reports, and National Infographic. Users select the latest or past survey results and materials, and are presented with the materials relevant to that publication, organised at national, ICS, PCN and practice level. Users can access all published current and archived reports from 2007 onwards.
Figure 8.1: Survey and reports page on the GPPS website

All current reports for national, ICS, PCN and practice level are accessible through this page, along with the other published reports as detailed in Tables 8.2 to 8.4. Please note that prior to 2022, reports are available for Clinical Commissioning Groups (CCG). These are no longer provided following changes to NHS reporting geographies: CCGs were abolished by the Health and Care Act 2022 and their powers transferred to Integrated Care Systems (ICS). Reports are now available for Primary Care Networks (PCN) and Integrated Care Systems (ICS)6.
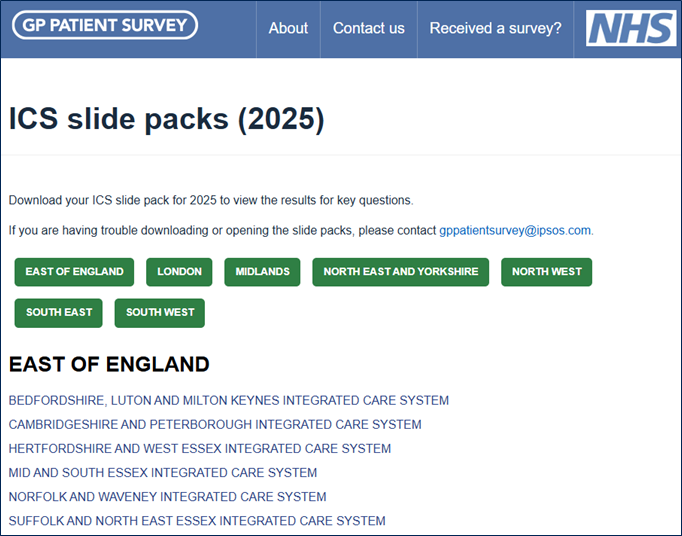
The ICS slide packs can be accessed by using the ICS drop down or the green button under ‘Additional outputs’. The slide packs are grouped by NHS region and listed alphabetically under each, to allow easy access to the PowerPoint reports (see Figure 8.2). ICS slide packs are also available for the 2024, 2023, 2022 and 2021 surveys. Prior to 2021, organisation slide packs were available at CCG level for the January 2015 publication onwards.
Figure 8.2: ICS slide packs

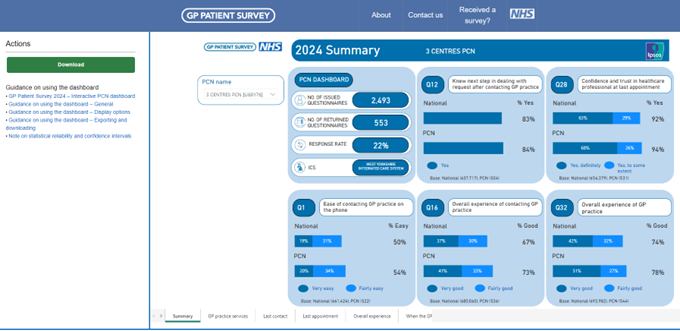
The PCN dashboard can be accessed by using the PCN drop down or the green button under ‘Additional outputs’. The dashboard provides an interactive tool with results for all questions for individual PCNs (including variation by practice within PCN for the latest years’ data) (see Figure 8.3).
Figure 8.3: PCN dashboard page

8.11 The GPPS analysis tool
The GPPS analysis tool is designed to help users analyse GPPS data. It allows analysis of the results for the current survey year, provides trend data (showing 2024 and 2025 results only due to changes in the questionnaire and survey methodology) and includes a crosstabulation function.
8.11.1 2025 results
From the main Analysis Tool homepage users select 2025 results, which allows them to look at the data from the most recent publication.
Results can be viewed at practice, PCN, ICS, and national level. After selecting an organisation level there are two options:
-
View Results: this section of the website allows the user to select a question or series of questions and view the results as a table or chart for their selected organisations These findings can be filtered based on different patient groups, for example, by age, ethnicity, or long-term condition.
-
It is also possible to add other organisation results. Up to four additional geographies or organisations may be added for comparison
-
-
When selecting a practice, for example, add one additional practice result, results for the relevant PCN, ICS and the national results for comparison. When selecting a PCN, add up to two additional PCN results, one ICS result, and the national results for comparison.
-
When selecting an ICS, add up to three additional ICS results, and the national results for comparison
-
All charts are available for download in Excel and PowerPoint formats.
-
Create a crosstab: this section of the website allows the user to create crosstabulations of the data, to look at the relationship between two questions in table format. For example, what happened when the patient phoned their practice (Q11) analysed by overall experience of contacting their GP practice (Q16). This can also be filtered based on patient groups, for example, by sexuality, age or working status, and the results are available to download in Excel format.
-
The number of levels available in the crosstab function varies by the organisation level selected:
-
-
Practice crosstab: one additional level. Split the responses to a question, or set of questions, by one additional variable.
-
PCN crosstab: one additional level. Split the responses to a question, or set of questions, by one additional variable.
-
ICS crosstab: two additional levels. Split the responses to a question, or set of questions, by up to two additional variables.
-
National crosstab: two additional levels. Split the responses to a question, or set of questions by, up to two additional variables.
-
-
-
-
8.11.2 Trends
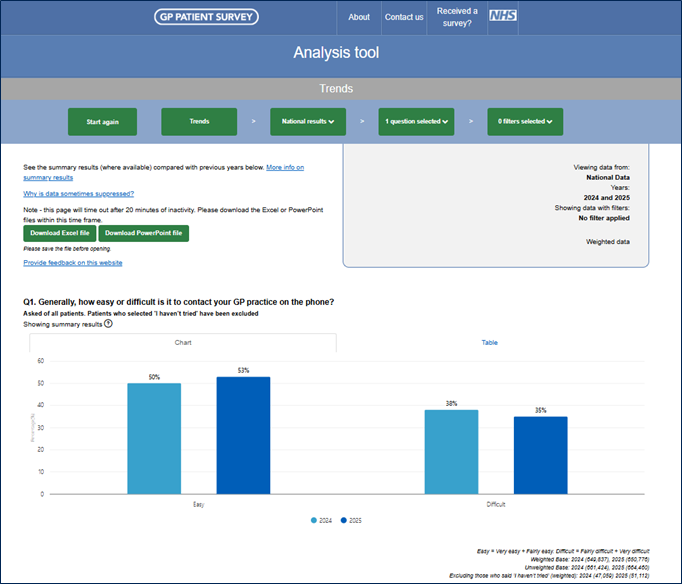
This section allows users to compare current data with the previous year. Trends are available from 2024 onwards. Note that this option displays summary results where available (see section 8.1).
Figure 8.4: Website analysis tool - Trends 2024 and 2025

8.12 Practice comparison tool
Since June 2015, the main GPPS website also allows users to compare results across practices. This tool is available either through the practice search function on the home page or via the ‘Search for a practice’ and ‘Compare a practice’ links on the home page.
The practice comparison tool allows users to:
-
view the results for a particular practice for a set of key questions and compare these results with the local ICS and national results.
-
compare results with another local practice (within a 5-mile radius); and
-
compare results with any other practice in the country.
Since July 2022, a practice summary PowerPoint download (‘Practice Infographic’) has been available with results for a particular practice for a key set of questions. Users can access this by searching for a practice, then clicking on the green ‘Practice Infographic (PowerPoint)’ button on the Practice overview and Area comparison tabs.
6Prior to January 2016, reports are available for Regions and Area Teams; these are no longer provided following the integration of Area Teams into the four Regional Teams which existed at that time.


