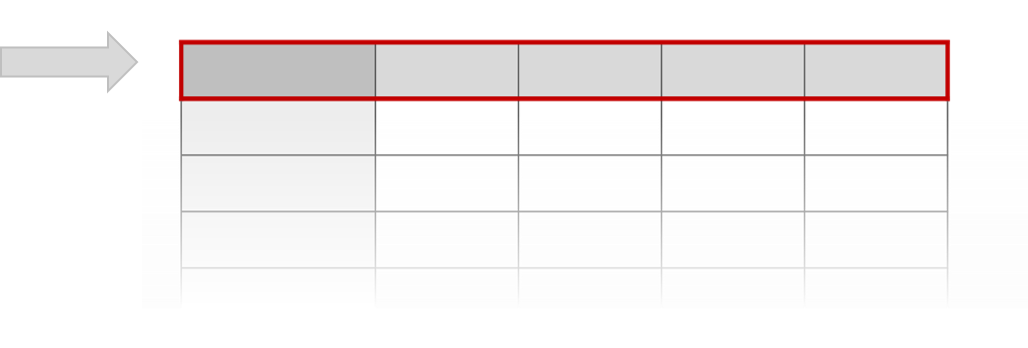
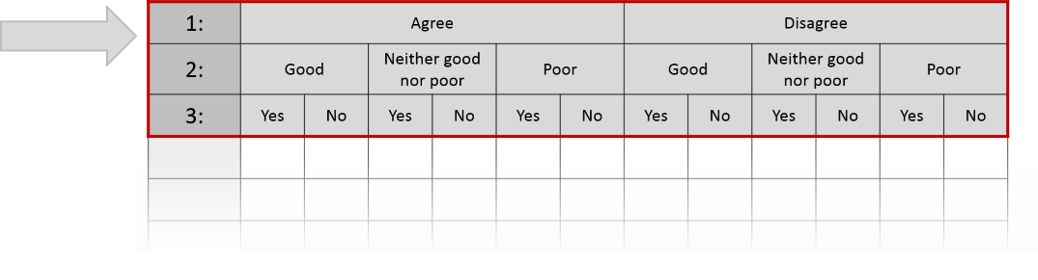
Viewing as a table allows you to break the results down by multiple survey questions. This includes all of the survey and demographic questions asked.
Select the question(s) you want to see in the first column. If you select multiple questions then these will be displayed as separate tables.
Note - select one section at a time to limit the volume of data and reduce processing times.
Select the main question(s) you would like to compare against other questions.
The answers from this question will make up the rows of the table.
If you select multiple questions they will be displayed as multiple tables.
Select the question you want to see in the rows.
Select the question you would like to compare against. This question will be displayed in the columns.
Answers to the main question will be compared against answers to this question.
You can select from any of the survey and demographic questions.
Any questions selected above will not be available as comparators here.
Loading crosstab data...
Your feedback is really important to us. It tells us who is using the GP Patient Survey and allows us to improve your experience in the future.
While all the information below is helpful for us, none of the fields are mandatory.